Dax 30: la base del perfecto canal alcista que desarrolla desde los mínimos del año 2009 transcurre actualmente por niveles entre 11.200 y 11.300 puntos:
HA LLEGADO A LA CREACIÓN DEL REGISTRO: select * from cms_banners where activo and tipo = 'intext' and visible_en in (0,2,7) and (hora_inicio<='17:04:37' or hora_inicio='00:00:00') and (hora_fin>='17:04:37' or hora_fin='00:00:00') and (select count(*) from cms_banners_portadas where id_banner=cms_banners.id_banner and id_portada=1)>0 and id_banner not in (0,22,23,24,21) order by prioridad desc, posicion asc, RAND() limit 1HA LLEGADO A LA CREACIÓN DEL REGISTRO: select * from cms_banners where activo and tipo = 'intext' and visible_en in (0,2,7) and (hora_inicio<='17:04:37' or hora_inicio='00:00:00') and (hora_fin>='17:04:37' or hora_fin='00:00:00') and (select count(*) from cms_banners_portadas where id_banner=cms_banners.id_banner and id_portada=1)>0 and id_banner not in (0,22,23,24,21,87) order by prioridad desc, posicion asc, RAND() limit 1

Euro Stoxx 50: el paso de la directriz alcista desde los mínimos de 2011 confluye con la zona de soporte constituida por los máximos de 2016, antigua resistencia, ahora soporte. La zona de confluencia se sitúa entre 3.050 y 3.100 puntos:

HA LLEGADO A LA CREACIÓN DEL REGISTRO: select * from cms_banners where activo and tipo = 'intext' and visible_en in (0,2,7) and (hora_inicio<='17:04:37' or hora_inicio='00:00:00') and (hora_fin>='17:04:37' or hora_fin='00:00:00') and (select count(*) from cms_banners_portadas where id_banner=cms_banners.id_banner and id_portada=1)>0 and id_banner not in (0,22,23,24,21,87,88,89) order by prioridad desc, posicion asc, RAND() limit 1
Ibex 35: la proyección de caída teórica de la formación de continuación bajista se sitúa en 9.400 puntos, cerca de la zona de soporte situada entre 9.100 y 9.300 puntos. Se establece así un área de referencia entre los 9.100 y 9.400 puntos:
%%%Configura tus alertas sobre Ibex 35|IBEX-35%%%
HA LLEGADO A LA CREACIÓN DEL REGISTRO: select * from cms_banners where activo and tipo = 'intext' and visible_en in (0,2,7) and (hora_inicio<='17:04:37' or hora_inicio='00:00:00') and (hora_fin>='17:04:37' or hora_fin='00:00:00') and (select count(*) from cms_banners_portadas where id_banner=cms_banners.id_banner and id_portada=1)>0 and id_banner not in (0,22,23,24,21,87,88,89) order by prioridad desc, posicion asc, RAND() limit 1
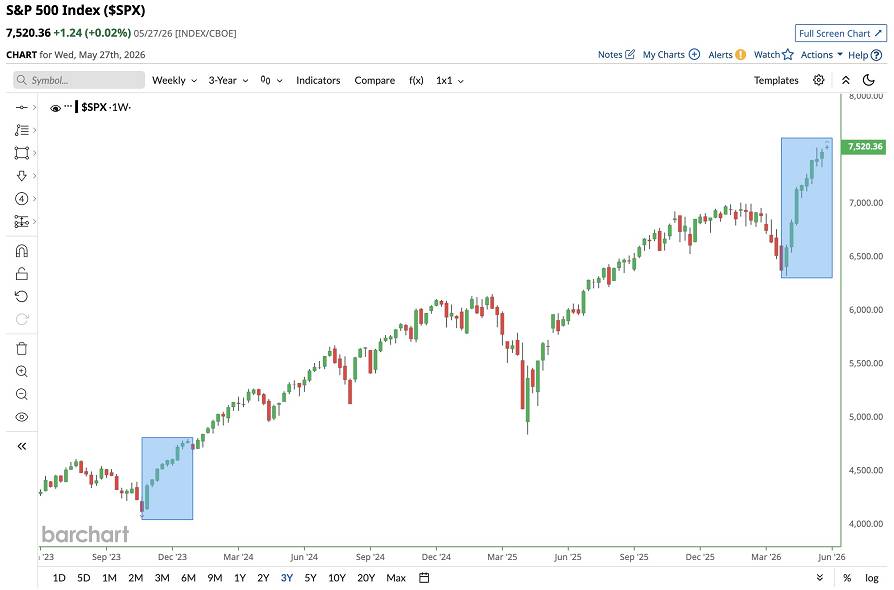
S&P500 - VIX: la caída de hoy debería marcar una primera zona de mínimos durante unas semanas:
HA LLEGADO A LA CREACIÓN DEL REGISTRO: select * from cms_banners where activo and tipo = 'intext' and visible_en in (0,2,7) and (hora_inicio<='17:04:37' or hora_inicio='00:00:00') and (hora_fin>='17:04:37' or hora_fin='00:00:00') and (select count(*) from cms_banners_portadas where id_banner=cms_banners.id_banner and id_portada=1)>0 and id_banner not in (0,22,23,24,21,87,88,89) order by prioridad desc, posicion asc, RAND() limit 1
Los saltos de niveles de volatilidad se acercan a los niveles máximos experimentados en las principales correcciones del ciclo alcista nacido en 2009. La sobrecompra en el VIX es muy elevada, siendo siempre asociada a reversiones de volatilidad. Esperamos que cerca de los mínimos de hoy martes se establezca una primera zona de estabilización, pese a que en días posteriores puedan darse alguna réplica nerviosa que los infrinja de forma fugaz.